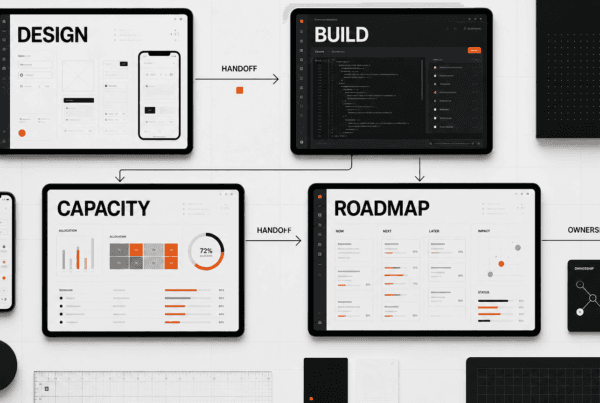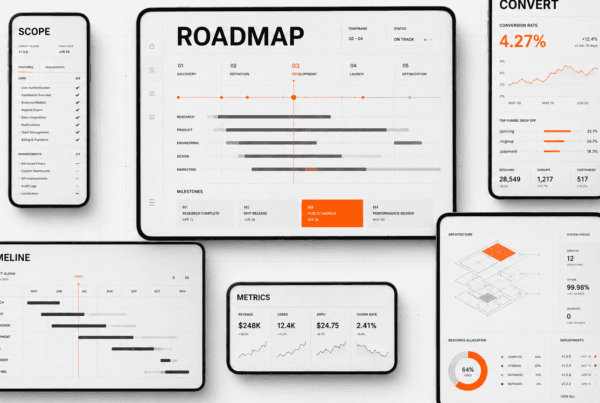

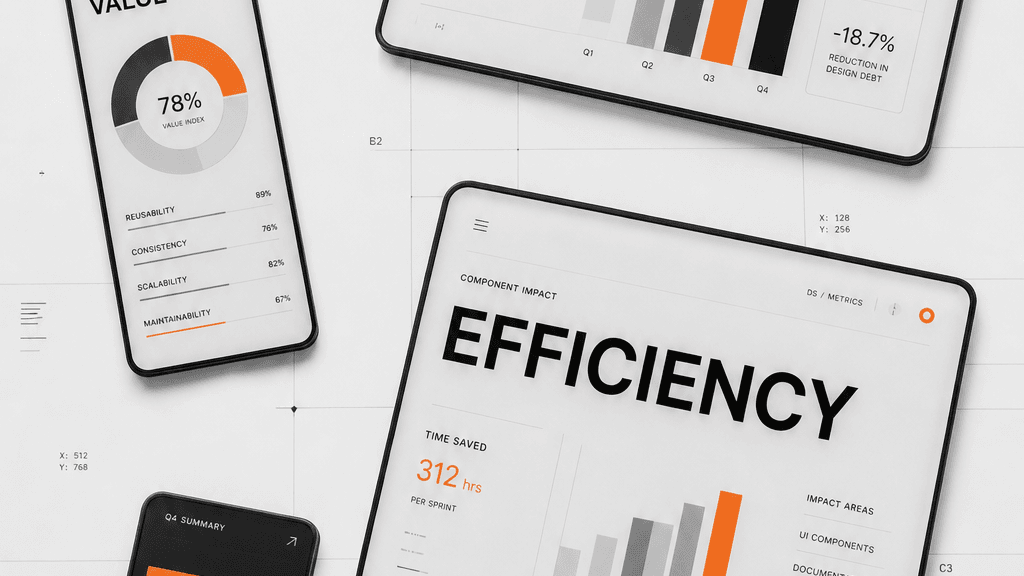
TL;DR: Design system ROI for B2B SaaS shows up when teams ship common product UI faster, reuse accessible components, reduce design and engineering rework, and create a more consistent product experience across modules.
- Measure ROI with cycle time, component reuse, design QA effort, UI defects, accessibility fixes, and onboarding time.
- Treat adoption as the lead metric. A library that teams ignore creates cost without changing delivery behavior.
- Connect system work to B2B SaaS outcomes: faster feature launches, clearer dashboards, lower support friction, and better retention signals.
- Keep governance light enough for teams to use and firm enough to prevent component forks, token drift, and one-off patterns.
For a B2B SaaS team, design system ROI for B2B SaaS is the financial case for turning repeated interface decisions into shared product infrastructure. The goal is practical: spend less time rebuilding buttons, tables, filters, forms, modals, empty states, dashboards, and settings patterns so the team can spend more time on product behavior that customers pay for.
DesignX sees this pressure in SaaS and enterprise UX work all the time. A product grows from one surface into admin tools, analytics, onboarding, billing, permissions, reporting, and mobile flows. If every squad solves those patterns alone, speed drops and the user experience starts to fracture. Our work across product, brand, and large catalog systems, including Klein Tools and senior operator experience from Bodybuilding.com, HP, Panasonic, and Oura, points to the same lesson: repeatable systems create commercial value only when teams adopt them.
The live DesignX cluster already covers enterprise design system governance and the operational role of a design system component library. This guide focuses on the ROI model B2B SaaS leaders can defend in budget, roadmap, and board conversations.
Why Design System ROI for B2B SaaS Is Different
B2B SaaS products carry dense workflows, long sales cycles, complex permissions, edge cases, and users who return to the same screens every workday. A small UI inconsistency is easy to dismiss in a marketing site. In a product where users live inside dashboards, tables, approvals, and reports, inconsistency becomes training cost, support cost, and product distrust.
That is why the ROI case should start with product operations, not brand polish. A design system helps the business when it changes how teams ship, maintain, test, and learn. In our B2B UX design guide, we frame B2B UX ROI around time-to-value, task completion, adoption, and retention. Design system ROI uses the same logic, then adds reuse and governance metrics.
External data supports the direction. Figma’s 2024 Forrester TEI page reports a 40% efficiency gain during problem definition and a 60% improvement across ideation and creation phases for teams using Figma and FigJam. Use that as adjacent evidence for a broader point: shared tools and reusable workflows help product teams move from messy input to shipped decisions faster.
The Four ROI Buckets That Hold Up in a SaaS Budget Review
A CFO or CTO will not fund a design system because the product looks cleaner in screenshots. They will listen when the system reduces repeat work, lowers release risk, helps teams onboard faster, and improves product quality in places customers use.
| ROI bucket | What to measure | Why it matters for B2B SaaS |
|---|---|---|
| Feature velocity | Cycle time for common UI work, sprint carryover, design-to-dev handoff questions, time from approved design to merged component. | Product teams can ship new account settings, reporting views, onboarding steps, and dashboard states without rebuilding known patterns. |
| Reuse and rework reduction | Component reuse rate, detached components, token overrides, duplicated CSS, UI defects, visual QA rounds. | Reuse turns the system from a design artifact into delivery infrastructure. Rework reveals where the system is incomplete or hard to trust. |
| Onboarding and enablement | New designer or engineer time to first useful contribution, documentation search success, support questions in Slack or Linear. | B2B SaaS teams grow by adding specialists. The system should reduce tribal knowledge and help new people ship within existing standards. |
| Quality and risk control | Accessibility defects, regression bugs, inconsistent empty states, form errors, broken focus states, support tickets tied to confusing UI. | Shared components let teams solve quality problems once, then carry the fix across many product surfaces. |
Start With a Baseline Before You Build the Business Case
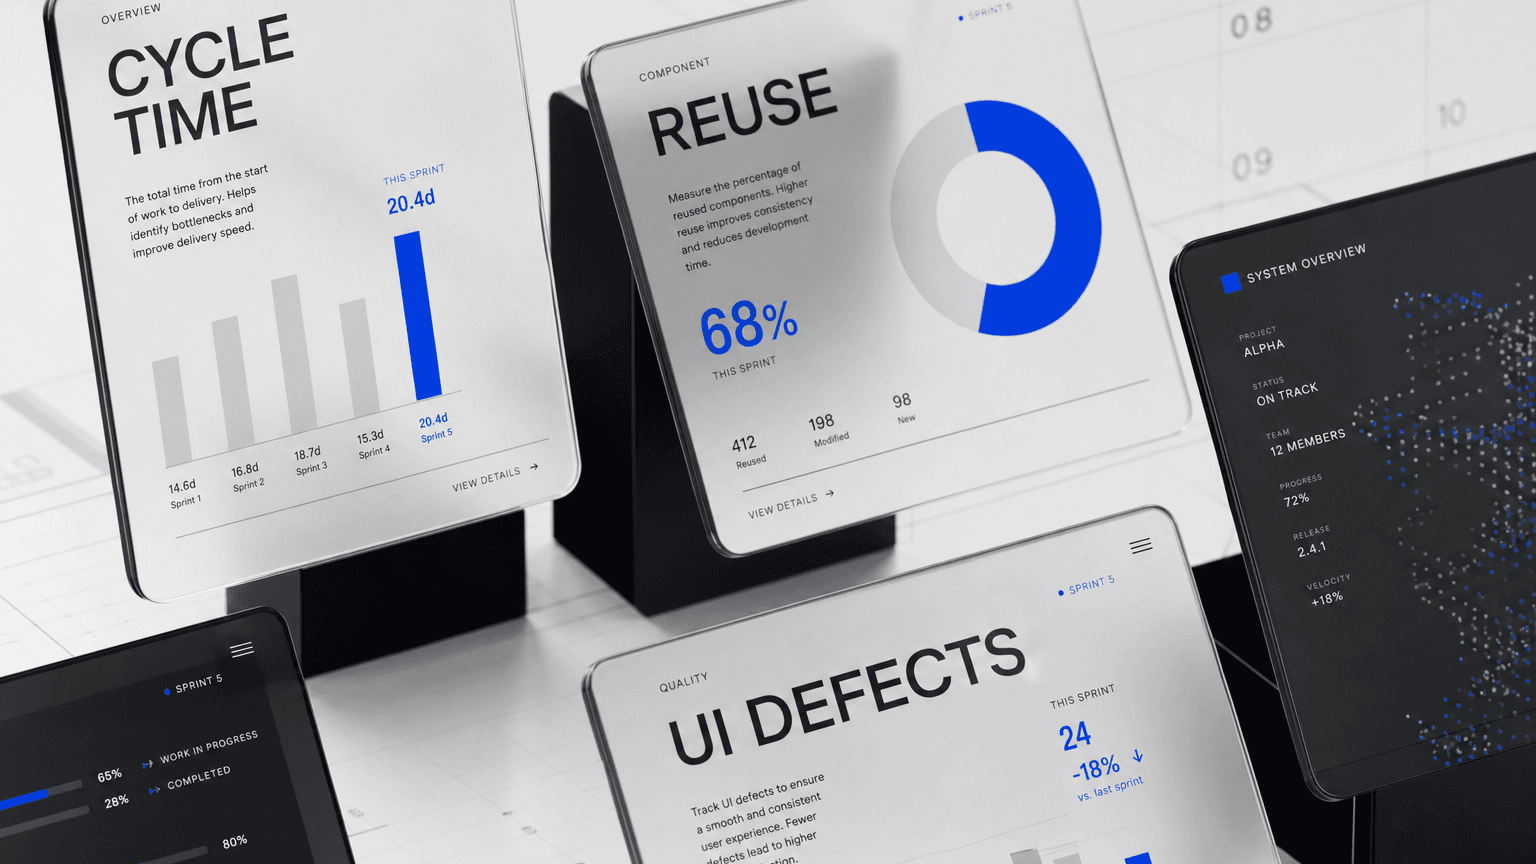
The easiest ROI mistake is measuring only after the system exists. Capture the current cost first. You need the messy baseline: how long designers spend creating repeat screens, how long engineers spend translating those screens, how many UI defects QA catches, how often components fork, and how much time senior people spend answering the same usage questions.
A useful baseline can come from a two-week sample. Pick one product squad and review the UI work that shipped. Count repeated patterns, custom components, design QA comments, reopened tickets, accessibility bugs, and handoff questions. Then review one larger workflow, such as permissions, dashboards, reports, or onboarding, where reuse should matter.
- Design baseline: hours spent on repeat layouts, one-off variants, missing states, and review comments.
- Engineering baseline: custom UI code, duplicated components, pull-request churn, and time spent matching specs.
- QA baseline: visual defects, accessibility bugs, responsive issues, and regression checks tied to UI behavior.
- Product baseline: time-to-value, feature adoption, support tickets, and user confusion in high-volume flows.
This baseline also protects the project from vanity metrics. The zeroheight 2026 Design Systems Report says adoption and awareness were the biggest challenges for the fifth year in a row, with buy-in satisfaction dropping from 42% to 32%. That is the warning label. A system can have nice docs and still fail if teams do not use it.
The Simple Payback Formula
Use a model that a non-designer can audit. The formula should be boring enough for finance and specific enough for product leadership.
Quarterly system value = time saved on repeat UI work + avoided rework + avoided quality risk + faster onboarding value.
Quarterly system cost = design system team time + engineering support + documentation + governance rituals + tooling.
ROI = (quarterly system value – quarterly system cost) / quarterly system cost.
Do not overclaim revenue. A design system rarely creates new revenue by itself. It supports revenue by helping the team ship better product surfaces, improve activation, reduce friction, and keep quality steady as the product grows. If a faster onboarding flow improves activation, attribute the product outcome to the onboarding project. Attribute the system share to the reusable patterns, accessibility support, and delivery speed that made the project cheaper or faster.
A practical example: if three squads save 12 hours per sprint on common UI work, and the blended design and engineering cost is $110 per hour, the system creates $3,960 of time value per sprint before you count fewer bugs, faster onboarding, or avoided accessibility rework. That number is small enough to verify and large enough to compound.
Design System ROI Metrics Worth Tracking
Use a scorecard with a small set of metrics people can explain. If the scorecard needs a glossary, the team will stop using it.
- Adoption by team and product area. Track which squads use the system in production, not only who opened the Figma library.
- Component reuse rate. Measure how many shipped UI elements come from approved components instead of custom code or detached variants.
- Cycle time for repeated UI work. Compare common patterns before and after system adoption.
- Design QA comments per feature. Watch for fewer spacing, state, interaction, and consistency comments.
- Accessibility defects by component. Track keyboard, focus, contrast, label, error, and responsive issues at the component level.
- Documentation success. Count search terms with no result, unanswered Slack questions, and docs pages that do not lead to use.
- Exception and contribution volume. Record where teams ask for new variants or break the system. Those requests reveal product reality.
The accessibility line matters. WCAG 2.2 frames accessibility guidance as testable criteria that help make web content accessible to a wider range of people. B2B SaaS teams should not rediscover focus states, labels, error messages, contrast, and keyboard behavior one feature at a time. Put those decisions into the component system and test them before they spread.
Governance Is Where ROI Survives
Many design systems lose ROI after the first launch. The initial library reduces visible mess, then product teams hit edge cases, documentation goes stale, engineers fork components, and leaders see a maintenance cost instead of a delivery asset. Governance prevents that slide.
Good governance gives the system an intake path, contribution rules, release notes, deprecation rules, accessibility review, and adoption reviews. Our enterprise governance model uses those rituals to keep components, tokens, documentation, and shipped UI aligned across large product teams.
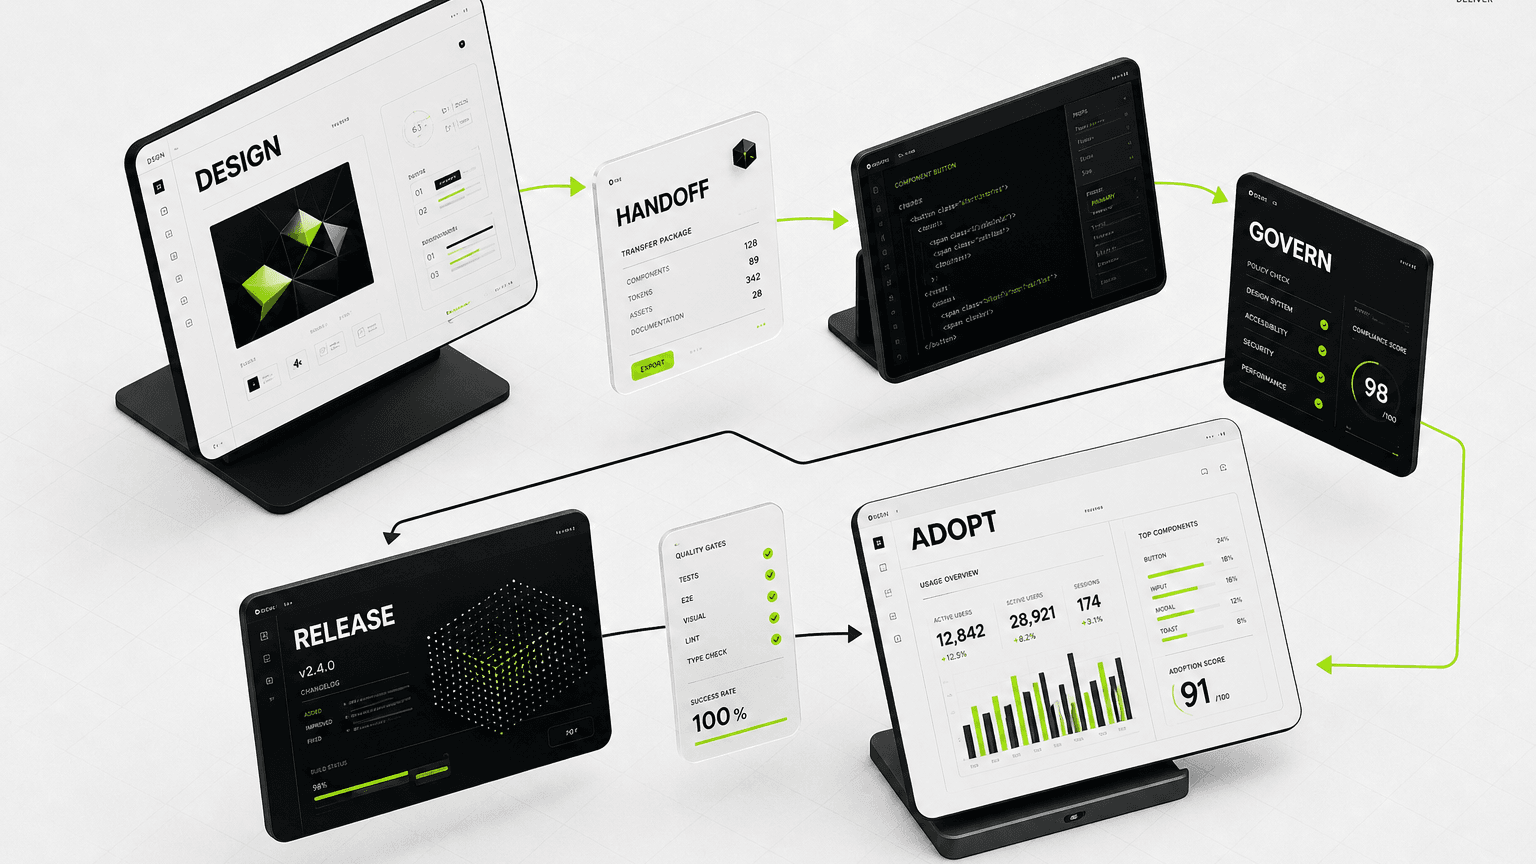
This is also a developer experience issue. Atlassian’s developer experience guidance ties developer experience to the quality of tooling and process. A design system is one of those internal tools. If engineers trust the components, docs, release process, and contribution path, they spend less time fighting interface plumbing and more time building product logic.
A 90-Day Plan for B2B SaaS Teams
Do not try to systematize the entire product in one pass. Pick the patterns with the highest reuse, highest defect volume, or highest user exposure. A smaller system with adoption beats a giant library teams avoid.
| Timeframe | Work | Output |
|---|---|---|
| Days 1 to 15 | Audit five to seven high-volume product flows. Count duplicated components, UI defects, token drift, accessibility issues, and repeated handoff questions. | Baseline scorecard and first component priority list. |
| Days 16 to 45 | Build or repair foundations: tokens, buttons, inputs, select menus, modals, cards, tables, empty states, alerts, and loading states. | Reusable primitives plus acceptance criteria for design and code. |
| Days 46 to 70 | Pilot inside one product area with real feature work. Track cycle time, QA comments, accessibility issues, and contribution requests. | Before-and-after data from a live squad. |
| Days 71 to 90 | Publish docs, contribution rules, release notes, adoption dashboard, and next-quarter backlog. | Governance loop that leadership can review without reading the entire library. |
If the product already has scattered UI debt, pair this plan with a focused UX audit for SaaS. The audit shows which workflows carry the most customer and business risk. The design system then turns repeated fixes into reusable product infrastructure.
How This Connects to SaaS UX, Dashboards, and Retention
Design systems matter most in the product surfaces customers use to get work done. In B2B SaaS, that often means dashboards, tables, filters, permissions, reports, settings, onboarding, notifications, billing, and admin workflows. A fragmented system turns those moments into a slow drip of friction.
The DesignX guide to SaaS dashboard design best practices focuses on clarity, hierarchy, accessibility, and task completion. A design system lets a team apply those decisions repeatedly instead of debating every chart, card, empty state, filter, and table pattern from scratch.
Retention gains are harder to isolate, but the path is clear. Users stay when the product helps them complete recurring work with less confusion. A design system supports that outcome by making product behavior feel coherent across modules. It also helps product teams improve workflows without resetting visual and interaction quality every time they ship.
Where DesignX Fits
DesignX is a strong fit when a SaaS team has enough product surface area to feel the pain, but not enough internal design-system capacity to fix it alone. That often means a product with multiple squads, a growing dashboard or admin experience, scattered Figma files, inconsistent React components, weak documentation, or accessibility debt that keeps returning.
We can help with the audit, system architecture, component strategy, governance model, and product UX decisions that turn a design system into a delivery asset. If the team needs ongoing senior design capacity after the first pass, compare the economics in our guide to fractional design team vs full-time hiring and the broader DesignX pricing guide.
Ready to turn design debt into measurable product value? Talk with DesignX about a SaaS design-system audit.
Frequently Asked Questions
What is design system ROI for B2B SaaS?
Design system ROI for B2B SaaS measures the business value created when product teams reuse approved components, tokens, patterns, and documentation instead of rebuilding interface decisions for every feature. The strongest signals are faster feature delivery, less UI rework, cleaner accessibility compliance, shorter onboarding for new designers and engineers, and more consistent user experiences across product modules.
How do you calculate design system ROI?
Start with baseline delivery data before the design system becomes the default. Track hours spent on repeat UI work, UI defects, design QA cycles, accessibility fixes, and onboarding time. Then compare those numbers after adoption improves. A useful model is time saved multiplied by blended team cost, plus avoided rework and risk reduction, minus system build and maintenance cost.
Which design system metrics matter most?
The best metrics are adoption rate, component reuse, cycle time for common UI work, number of detached or forked components, token overrides, UI defect volume, accessibility issues, documentation search success, and new-hire time to first useful contribution. Component count alone is weak because a large unused library creates cost without changing how teams ship.
When should a SaaS company invest in a design system?
Invest when multiple teams ship overlapping UI, designers rebuild the same screens, engineers write custom components for common patterns, accessibility fixes repeat across products, or new hires need too much tribal knowledge to contribute. A lean system can start with the ten to twenty patterns that carry the most product volume.
Can a design system improve retention?
A design system can support retention when it improves the parts of the product users touch every week: dashboards, tables, settings, onboarding, reporting, permissions, and forms. The retention impact comes through less confusion, faster task completion, better accessibility, clearer workflows, and fewer product areas that feel disconnected from each other.
Who should own design system ROI?
Design, engineering, and product should share the scorecard. Design can measure adoption and consistency. Engineering can measure reuse, cycle time, defects, and code health. Product can connect system improvements to activation, support tickets, expansion, and retention. A single design system owner can manage the ritual, but the data needs cross-functional agreement.