Most enterprise teams budget design as a soft cost, then wonder why revenue, retention, and margin metrics stall. This article gives you a practical framework, including a 30-day sprint model, for connecting design investments to the business outcomes your CFO already tracks.
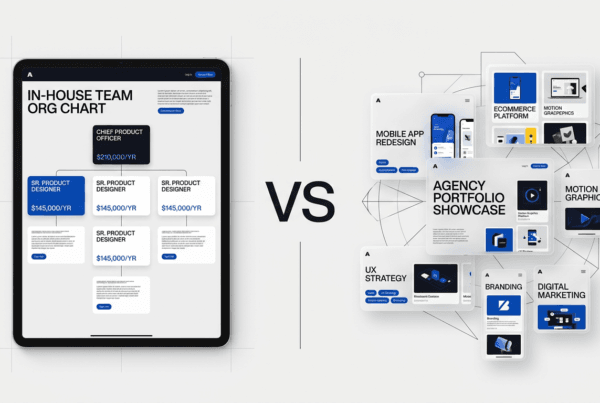
Design is one of the few business investments that can improve revenue, margin, and retention at the same time. Yet many enterprise teams still treat design as a soft cost, then wonder why growth slows even with steady demand.
If your CFO asks what design is returning, better UX will not hold up. You need a measurement model that ties design work to business outcomes your leadership team already tracks every week.
Why this conversation changed for enterprise teams
Five years ago, many companies funded design because competitors were investing in digital experiences. Today, budget conversations are tighter. Boards want proof. Finance teams want attribution. Product teams are asked to ship faster with fewer people. In that environment, design only wins budget when it shows measurable business impact.
The good news is that hard data already exists. McKinsey’s Design Index found that top-quartile design performers outperformed industry-benchmark revenue growth by 32 percentage points and outperformed total shareholder return growth by 56 percentage points over five years. That is not a vanity metric. That is core business performance.
Other studies point in the same direction. Forrester’s study on IBM’s design program reported a 301 percent ROI, major efficiency gains, and faster product delivery cycles. The exact percentage will differ by company, but the pattern is clear. Strong design systems reduce waste, improve conversion, and increase customer trust.
The mistake most teams make when measuring design ROI
Most teams only track one layer of impact. They focus on top-level conversion rates and miss operational efficiency. Or they focus on NPS and ignore pipeline velocity. That creates a weak business case because design value appears small when measured in isolation.
A stronger model measures four layers at once.
- Revenue impact: Conversion rate, qualified pipeline, average deal size, win rate support from better product experience.
- Efficiency impact: Fewer revision loops, lower engineering rework, faster launch cycles, lower support burden.
- Customer impact: Activation rate, retention, expansion revenue, customer effort score, NPS trend.
- Risk impact: Accessibility compliance, fewer usability errors, lower abandonment in regulated flows.
When you combine these layers, design becomes easier to defend in every quarterly planning meeting.
A practical scorecard CMOs and VPs can use
If you need one system that works across marketing, product, and growth, start with a monthly design ROI scorecard. Keep it simple enough to maintain and strict enough to trust.
Category 1: Demand and conversion
- Landing page conversion to demo request.
- Form completion rate by traffic source.
- Demo show-up rate after UX and messaging updates.
- Sales-qualified lead rate from website pipeline.
Category 2: Product and lifecycle outcomes
- Activation completion rate for new users.
- Time-to-value in first session.
- 30-day retention for key cohorts.
- Expansion triggers tied to product UX milestones.
Category 3: Delivery efficiency
- Cycle time from concept to shipped experience.
- Engineering hours spent on UX rework.
- Number of approval rounds per initiative.
- Design debt backlog trend.
Category 4: Business confidence
- Executive confidence score in roadmap readiness.
- Support ticket volume on high-value workflows.
- Accessibility and quality pass rate before launch.
How DesignX runs ROI-focused design sprints
The reason sprint methodology works is simple. It compresses decision-making, testing, and production into a fixed window, then connects every output to measurable outcomes before work starts. That prevents the classic pattern where teams spend months polishing screens without changing business results.
Our 30-day sprint model is built around three checkpoints.
- Week 1, Baseline: We lock baseline metrics across conversion, funnel friction, and delivery velocity.
- Week 2 and 3, Build and validate: We redesign high-impact flows, pressure-test assumptions, and prioritize pages with the largest revenue upside.
- Week 4, Launch and instrument: We ship with tracking in place so impact can be seen quickly.
This approach is useful for enterprise teams that need confidence before scaling changes across multiple product lines or regions.
What to instrument before you redesign anything
Many redesigns fail because measurement starts after launch. By then, you cannot isolate impact cleanly. Instrument first, redesign second.
At minimum, track:
- Primary conversion events and micro-conversions for each major page template.
- Field-level form drop-off for demo and contact flows.
- Session replay samples for enterprise traffic segments.
- On-page engagement depth for decision pages like pricing and solutions.
- Post-conversion quality signals such as SQL rate and sales cycle speed.
Pair quantitative signals with qualitative input from sales and customer success. If your sales team keeps hearing the same objection after prospects visit your site, that is a design and messaging signal you can act on.
The financial model executives understand
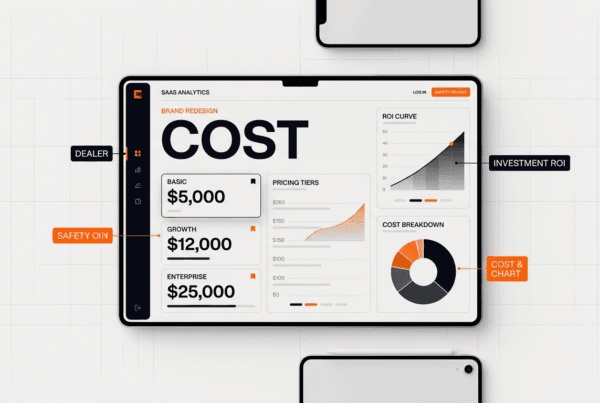
When presenting design ROI, translate every improvement into dollars. A simple model works well.
Design ROI = (Incremental Gross Profit + Cost Savings – Design Investment) / Design Investment
Example: if conversion improvements add $1.2M in annual gross profit, reduced support and rework save $250k, and sprint investment is $180k, the ROI case is straightforward. This is how design moves from subjective debate to strategic priority.
Do not wait for perfect attribution. Use directional confidence with strong baselines and keep refining each quarter. Leaders reward teams that are measurable and honest.
Common pitfalls that erase ROI
- Designing for stakeholder taste instead of user behavior. Internal preference does not beat observed friction.
- Changing too many variables at once. You lose attribution and cannot learn what caused lift.
- Skipping handoff discipline. Great concepts die in implementation gaps between design and engineering.
- Measuring vanity metrics only. Page views and likes do not pay for redesign programs.
A 90-day plan for enterprise leaders
If you want to put this into motion fast, use this sequence.
- Days 1 to 15: Build the baseline. Align marketing, product, analytics, and sales on KPI definitions.
- Days 16 to 45: Run a focused sprint on one high-value journey, usually demo acquisition or product activation.
- Days 46 to 75: Ship, measure, and report outcomes with financial translation.
- Days 76 to 90: Scale the playbook to the next journey with updated benchmarks.
You do not need a massive transformation program to prove value. You need one clean win tied to business outcomes. After that, executive buy-in becomes much easier.
Final takeaway
Enterprise teams that win with design do not treat it as decoration. They treat it as a growth system. The organizations that measure design against revenue, efficiency, and retention are the ones that keep compounding results while competitors debate pixel preferences.
If your team wants a practical path, start with one sprint, one scorecard, and one accountable owner for outcomes. That is enough to turn design from a cost center story into a performance story.
Sources: McKinsey Design Index research, Forrester Total Economic Impact study of IBM Design Thinking.
Executive dashboard template you can deploy this quarter
If you need one practical operating rhythm, run a monthly design business review with the same structure every time. Start with baseline metrics and trend direction. Move into experiment outcomes and what changed behavior. End with resource decisions for the next sprint cycle. Keep the deck short and numbers-driven.
A useful executive dashboard includes six KPIs only: primary conversion rate, qualified pipeline from digital, activation completion, engineering rework hours, support tickets on key flows, and sprint cycle time. When one metric dips, ask what design decision changed upstream. When a metric improves, document the pattern and repeat it.
The most effective teams also create a shared glossary for metric definitions. That avoids debate between product, marketing, and finance during reviews. Clarity on definitions is boring, but it prevents expensive confusion later.
How to secure budget without a long approval cycle
When budget is tight, start with a pilot scope that can produce evidence quickly. Pick one journey with direct revenue relevance. Set baseline numbers. Run one 30-day sprint. Then report outcomes in dollar terms and operational savings. This keeps approval friction low because leadership sees proof before scale.
Design leaders who win budget consistently do not ask for a broad transformation first. They ask for a focused test with a clear success threshold. That approach builds trust and creates the momentum needed for larger initiatives.
Related Reading
Frequently Asked Questions
What should teams know about the mistake most teams make when measuring design roi?
Most teams only track one layer of impact. They focus on top-level conversion rates and miss operational efficiency. Or they focus on NPS and ignore pipeline velocity. That creates a weak business case because design value appears small when measured in isolation.
What should teams know about a practical scorecard cmos and vps can use?
If you need one system that works across marketing, product, and growth, start with a monthly design ROI scorecard. Keep it simple enough to maintain and strict enough to trust. Category 1: Demand and conversion Landing page conversion to demo request. Form completion rate by traffic source.
How should teams measure how DesignX runs roi-focused design sprints?
The reason sprint methodology works is simple. It compresses decision-making, testing, and production into a fixed window, then connects every output to measurable outcomes before work starts. That prevents the classic pattern where teams spend months polishing screens without changing business results. Our 30-day sprint model is built around three checkpoints.
What to instrument before you redesign anything?
Many redesigns fail because measurement starts after launch. By then, you cannot isolate impact cleanly. Instrument first, redesign second. At minimum, track: Primary conversion events and micro-conversions for each major page template.
What should teams know about the financial model executives understand?
When presenting design ROI, translate every improvement into dollars. A simple model works well. Design ROI = (Incremental Gross Profit + Cost Savings – Design Investment) / Design Investment Example: if conversion improvements add $1.2M in annual gross profit, reduced support and rework save $250k, and sprint investment is $180k, the ROI case is straightforward. This is how design moves from subjective debate to strategic priority.